
The Social Side of Capital
Inferring Connections Between Portfolios
By Grant Fuller
How deep neural networks help explain investors' behaviour
At the most intuitive level, we understand markets in terms of price. Investors, financial journalists, board rooms and investor relations teams often use stock price as a proxy for investor sentiment, views and expectations. The connection between price and investors’ views exists because of the laws of supply and demand: we interpret rising prices as indicative of increased investor demand for a company’s stock and vice versa. Supply and demand arise as different institutional investment strategies respond to changing market opportunities and risks or develop new views tied to different allocations of capital within portfolios. Irithmics’ AI provides unique insights into the strategies, views and expectations of global institutional investors and funds as they change from day to day.
The core of Irithmics’ AI is a set of neural networks which analyse publicly available data, including regulatory and voluntary disclosures by corporates and asset managers. A deep neural network evaluates and models the views and expectations behind portfolios and allocations, and a reinforcement learning model learns how investors’ views and behaviours combine to form strategies. This post considers the third component of Irithmics’ AI which anticipates how views and strategies affect the allocation of capital by institutional portfolios and generate supply and demand pressure.
Supply and demand pressure results to a substantial degree from institutional investment strategies allocating (generating demand) and reallocating (generating supply) capital within portfolios. Strategy isomorphism (the tendency for strategies to become similar because institutional investors face similar constraints and address these in similar way) increases the probability of seemingly coordinated allocation and reallocation behaviour. This phenomenon is commonly leveraged by corporate investor relations teams to target investors and for capital access campaigns. When sufficiently acute, it has been suggested by Nobel Laureate, Robert Shiller, and numerous other scholars, that such homogeneity of views and behaviour contributes to price shocks, market bubbles and crashes.
Irithmics AI recognises and classifies patterns of institutional allocations and learns how these evolve in response to changing market environments. These patterns are used to model the degree of isomorphism of institutional investment strategies and views, enabling Irithmics to describe and anticipate future allocations and reallocations and consequently future supply and demand pressure. While strategy isomorphism increases the probability of seemingly coordinated, homogeneous behaviour amongst investors, it does not provide deterministic certainty such behaviour will occur. This is similar to how doctors understand that certain genetic variants, environmental and lifestyle factors increase the probability of different diseases occurring, but they do not mean the disease will occur, simply that it is more likely.
Each day, Irithmics’ AI anticipates future supply and demand pressure for the subsequent 90 days, updating forecasts as its models respond to observed institutional behaviour. It is obvious that anticipated future institutional supply and demand pressures are not directly predictive of future price; after all the market also involves other players (e.g. private investors, speculators) and responds to acute events (e.g. unexpected news) beyond the scope of longer-term institutional investment strategies. The degree to which longer-term strategic decisions or acute speculative views affect price varies over time and across assets. In certain periods the acute decisions of speculative views may have a large enough impact on price to overshadow the impact of institutional strategic decisions; in other periods the impact of the latter on price is evident. At Irithmics we believe that it is highly informative to view the anticipated institutional supply and demand in order to form and modify investment views in the light of the expected evolution of the views of others. Displaying the anticipated (modelled) supply and demand alongside subsequently observed price is a way to visualise time-windows when changes in price were concordant to the anticipated supply and demand; although this is obviously not known at the time forecasts are generated.
To illustrate this, we’ll consider two examples.
Irithmics AI assessment of the institutional strategies as-of Jan 2, 2018 anticipates supply and demand pressure for Barclays the subsequent 90 days to Apr 2, 2018. Just for clarity, Irithmics computed the full 90 day period to Apr 2, on Jan 2 (before the corresponding price data was observed) – this is similar to how meteorological services forecast weather, providing a forecast for every day.
Figure 1a shows the forecasted supply and demand pressure for Barclays from Jan 2, 2018 to Apr 2, 2018. Demand is considered to be associated with an increased probability of institutional capital being allocated to Barclays, while supply is associated with reallocation of capital from Barclays to other securities.
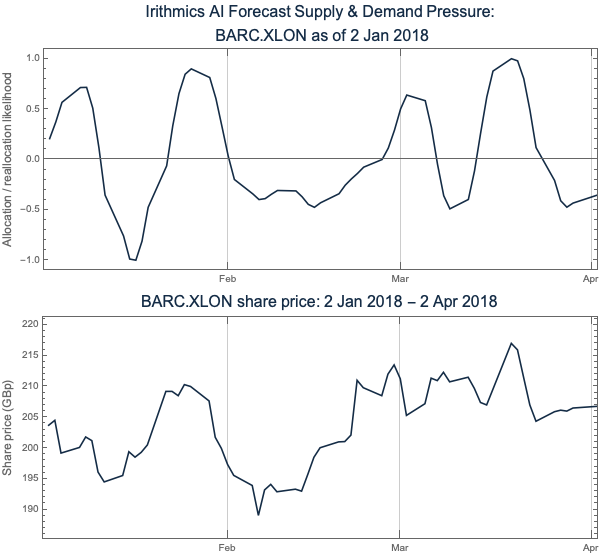
These forecasts show anticipated increase demand associated with isomorphic institutional strategy allocation of capital:
Similarly, the forecasts anticipate reduced demand and increased supply:
Figure 1b shows Barclays share price over the same period.
Irithmics AI assessment of the institutional strategies as-of Jul 1, 2020 anticipates supply and demand pressure for IAG the subsequent 90 days to Sep 29, 2020. Just for clarity, Irithmics computed the full 90 day period to Sep 29, on Jul 1 (before the corresponding price data was observed) – this is similar to how meteorological services forecast weather, providing a forecast for every day.
Figure 2a shows the forecasted supply and demand pressure for IAG from Jul 1, 2020 to Sep 29, 2020. Demand is considered to be associated with an increased probability of institutional capital being allocated to IAG, while supply is associated with reallocation of capital from IAG to other securities.
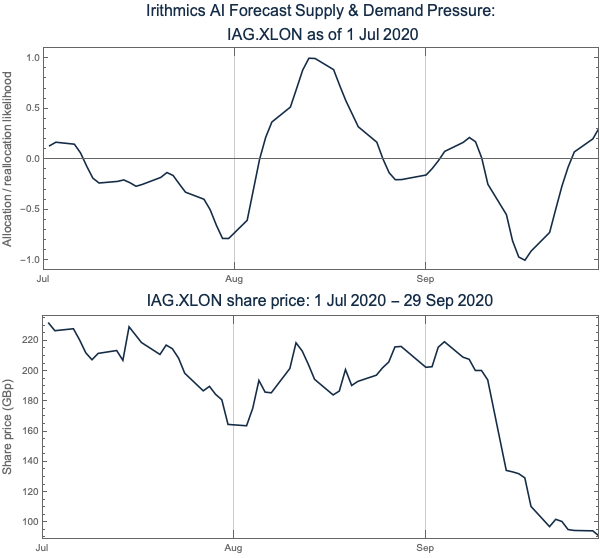
These forecasts show anticipated reduced demand associated with isomorphic institutional strategy reallocation of capital:
Similarly, the forecasts anticipate increased demand and reduced supply:
Figure #b shows IAG share price over the same period.
The Barclays and IAG case studies are useful, illustrative examples of deep neural network’s ability to decode institutional investment strategies and anticipate how these might affect future investor demand. Both examples illustrate how ex ante supply and demand forecasts reveal informative synergies with subsequently observed market activity, providing ex ante analysis into market fluctuations arising from institutional strategy isomorphism. However, there are a number of more subtle features which not only suggests how corporates can enhance the allocations they’re likely to receive from investors, but also how activists are more likely to leverage shareholder support and initiate a change in institutional strategies towards companies. This latter point has significant implications for activist investors, environmental and social movement campaigners.
Anticipating future supply and demand pressure has numerous tangible benefits, enabling:
In following blog posts we will explore each of these tangible benefits in more detail.
You can learn more about Irithmics AI's supply and demand pressure data and register for beta access to our data feeds from our website.
UPDATE (Jan 4, 2020): Beta access for FTSE100 constituent companies is now available.
Schedule a demo or get in contact for more details.
Get the latest on products updates, research and articles.